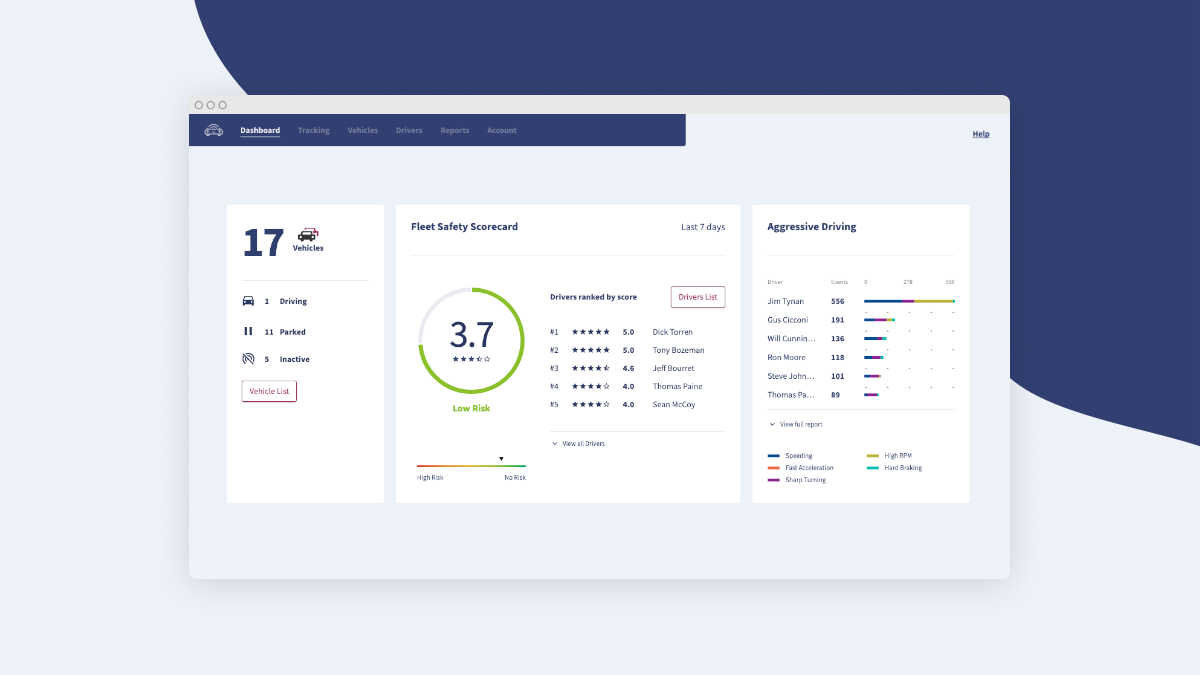
We’ve got a new release for you, and it’s chock full of new goodies to help you manage your fleet even more effectively! The fleet safety scorecard, aggressive driving and vehicle status tiles on our brand new dashboard may be the most important ones, but there sure is more, under the hood. And, there’s more on the way, as well! But, let’s have a look at what’s included.
Fleet Safety Scorecard
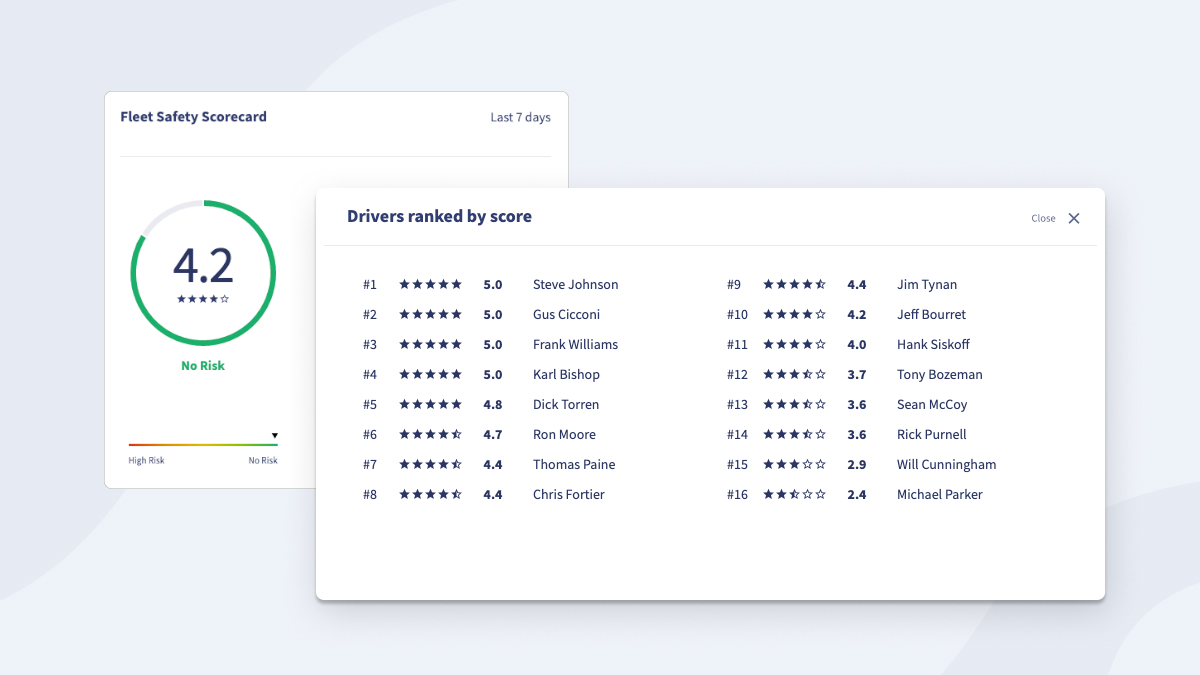
Get a glance at your dashboard and gain quick, summarized insights about the safety level of your fleet with key indicative metrics, on our new fleet safety scorecard. Not only will it help you improve your fleet strategy; if you use it right, it will also help prevent downtime and upkeep your company reputation. You’ll only need to make a habit of taking a quick look at the numbers on the fleet safety scorecard, every few days. Identify issues with driver behavior and offer your drivers these overdue state-certified fleet safety courses you’ve always suspected they need. Your fleet will thank you for it!
Aggressive Driving
Fleet safety is also dependent on how your drivers behave on the road. So, how about a summary of key metrics that indicate where each driver needs improvements? Besides, it would be great to know what kind of state certified safe driving lessons to give them, depending on what aspects they need to improve the most. And, did you know that with state certification for safe driving you can be eligible for reduced insurance rates? Not to mention, you could avoid speeding or other traffic-related tickets, altogether!
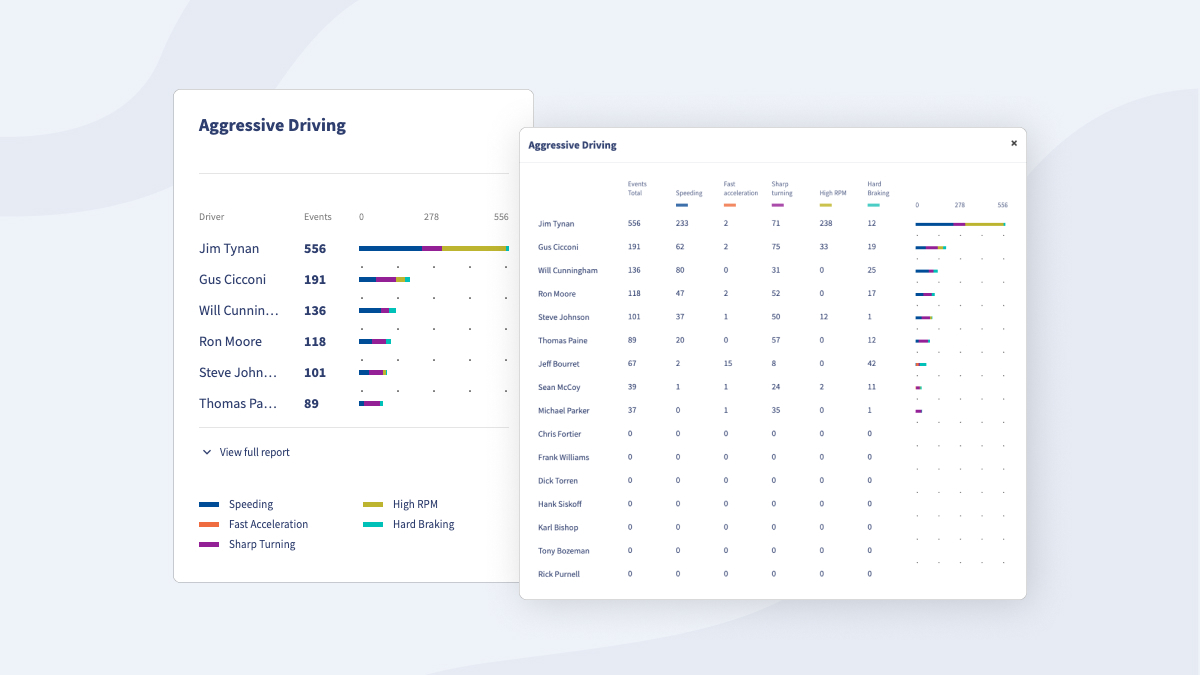
You can use the Aggressive Driving metric tile to glance at the number of speeding events, fast accelerations, sharp turns, high RPM and hard braking, ranked by driver. The number and type of events is used to calculate each driver’s safety score. And, while you can drill down to each event type, identifying different aspects that need improvement, a driver’s overall score will help with a quick decision on whether you need to help them or not.
Vehicle Status
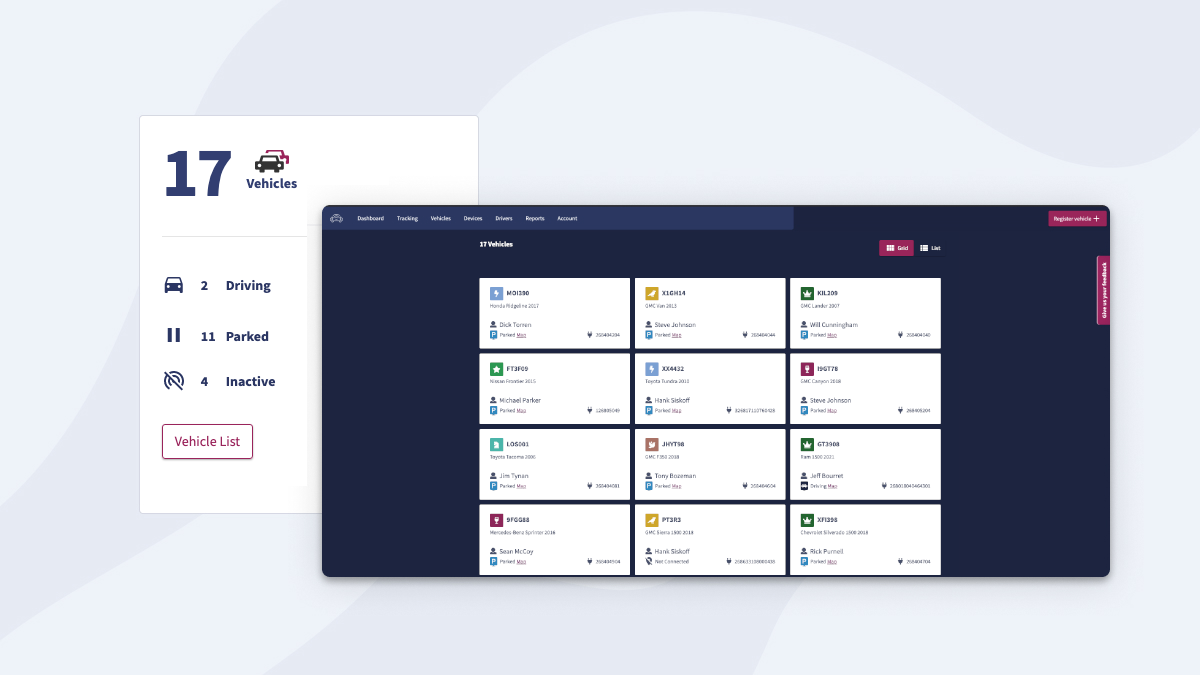
We’ve always treated you with a per-vehicle status snapshot. This was more about the key indications of a vehicle’s health. But, how about fleet utilization? With our newest addition in metric tiles, you’re now able to quickly glance at how your fleet is being used and reach your conclusions about how optimally this is done. Unanswered questions like “Do I need extra vehicles?” or “Am I paying for more than I need?”, will be a thing of the past, in no time!
One thing is for sure, though; this won’t be the end of it. There’s more goodies coming up, to facilitate your vehicle management even more.
Here’s a quick look at the full list of additions and improvements you’ll be able to make use of in our latest release:
Release Notes
New features:
- New navigation paradigm, including all our new features, as needed
- A new Dashboard, to improve performance and enhance fleet insights
- Dashboard vehicle status metric tile, as a summary for fleet utilization
- Dashboard Fleet Safety Scorecard metric tile, as a fleet median, complete with averaged driver scores
- Aggressive Driving metric tile, as a per-driver score, to identify driving aspects that need improvement
Fixes:
- Improved web app, for better response time on all devices
- Improved responsive design of the web app, to support viewing on mobile devices
- Several UI fixes, aiming to improve user experience in getting the information they need easier and faster
Improvements:
- Performance improvements, for even faster screens
- Architecture and technology refactoring to include new connectivity features and an improved billing experience